
Page 4 - Alagna_al_ECSS2013
P. 4
122 A. Alagna et al. / Estuarine, Coastal and Shelf Science 119 (2013) 119e125
8.00 8.00
Max leaf width (cm + SE) Max root length (cm + SE)
Max leaf length (cm + SE)4.004.00
0.00 0.00
0.80
T0 T1 T0 T1
0.40
0.00
T0 T1
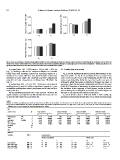
Fig. 3. Short-term variation of seedling morphological variables in three microhabitats. Results are showed only for variables for which significant interaction between Time and
Habitat were detected. Microhabitats were: Sand (empty bars); rock covered by Cystoseira amentacea var. stricta (grey); and rock covered by Halopteris e Dilophus spp. (black). As no
significant difference between sites was detected, data within each microhabitat were pooled.
LR ranged from 1.65 Æ 0.35 [mean Æ SE] to 4.90 Æ 0.35 cm 3.3. Seedling long-term growth
(Fig. 3). Seedlings collected on Halopteris-Dilophus turf showed
longer roots than seedlings collected on macroalgal stands of C. NL, LL and WL significantly differed among Microhabitats in the
amentacea var. stricta, which in turn showed higher values than long-term (Table 3a, b). NL of seedlings from Cy ranged from
seedlings on sand (Table 2b). However, pair-wise comparisons 11.50 Æ 0.56 to 6.83 Æ 0.17 at the beginning and the end of the
only detected root elongation in seedlings from HD (Table 2b, study, respectively (Fig. 4). NL decreased on Cy after one year of
Fig. 3). settlement, while there were no differences between NL values at
successive times. NL decreased continuously on HD over the years
LL varied from 4.32 Æ 0.11 to 7.23 Æ 0.24 cm. LL increased in (Table 3b). The pattern of decreasing NL values over time was due to
seedlings from Cy and HD, while no significant increase in LL was the inclusion in the counting of small leaves, similar to bracts,
recorded in seedlings from sand. LL was greater on HD than on Cy or present during the seedling first years of life. NL resulted higher on
sand (Table 2b). HD than on Cy after the first and the second year.
WL was comprised between 0.47 Æ 0.02 and 0.64 Æ 0.04 cm. WL LL varied between 6.02 Æ 0.48 and 25.46 Æ 1.04 cm (Fig. 4),
significantly increased within each Microhabitat but was greater on increasing continuously through time on Cy, while increasing only
Cy and HD with respect to sand (Table 2b).
Table 3
ANOVA on seedling morphological variables performed on two different microhabitats over the long-term. The table shows only variables for which significant interaction
between time and Microhabitat was detected. (A) Main analysis. (B) Pairwise comparisons (SNK tests). T0: July 2004; T1: July 2005; T2: July 2006; HD: rock covered by Halopteris
e Dilophus spp.; Cy: rock covered by Cystoseira amentacea var. stricta.
(A)
Source of var. df Leaf number Max leaf length Max leaf width Rhizome length
FP F P F P F P
Microhabitat Mh 1 4.17 0.1778 7.08 0.1170 4.36 0.1722 5.85 0.1368
Time 0.0001 48.17 0.0016 42.03 <0.0001
Site (Mh) Ti 2 522.60 <0.0001 258.94 0.0224 0.1985
Mh  Ti 0.0085 1.73 0.0231 1.21 0.3205
Ti  Si (Mh) Si (Mh) 2 0.56 0.5798 4.47 0.6123 11.17 0.8040 5.36 0.0326
Residual 0.34 0.7196
Total 2 19.40 0.0087 19.72 0.40
4 0.10 0.9827 0.68
24
35
(B)
SNK test
Variable Effect Interpretation
Within microhabitat Within time
Leaf number Mh  Ti T0 T1 T2 Cy HD
Max leaf length Mh  Ti
Max leaf width Mh  Ti Cy ¼ HD Cy < HD Cy ¼ HD T0>T1 ¼ T2 T0>T1>T2
Rhizome length Mh  Ti Cy ¼ HD Cy ¼ HD Cy < HD T0<T1<T2 T0<T1 ¼ T2
Cy ¼ HD Cy < HD Cy < HD T0 ¼ T1 ¼ T2 T0<T1<T2
e Cy ¼ HD Cy < HD T1<T2 T1<T2