
Page 3 - Alagna_al_ECSS2013
P. 3
A. Alagna et al. / Estuarine, Coastal and Shelf Science 119 (2013) 119e125 121
2.3. Sampling procedures Table 1
ANOVA on seedling density among microhabitats. (A) Main analysis. (B) SNK tests.
Seedlings density over time was estimated from in situ counts. T0: July 2004; T1: July 2005; T2: July 2006. Microhabitats were rock covered by
At each sampling occasion, seedlings were counted within a 1 Â 1 m Halopteris e Dilophus spp. (HD); shallow rock covered by C. amentacea var. stricta
square frame that was randomly thrown until all counts were made (SCy); rock covered by Cystoseira amentacea var. stricta (Cy); gravel (Gr); and sand
for each microhabitat type at each site. Density variation over time (Sa).
was computed as the percentage of seedling recorded at any given
replicate against the overall mean recorded at the initial time. (A)
Density counts were carried out annually between 2004 and 2006,
always in July. Source of variation df F p
Seedling growth was estimated from morphological measures Microhabitat Mh 4 70.31 0.0001
taken on collected individuals. Seedlings were collected at random Time
from each microhabitat type within each site, in zones different Site (Mh) Ti 2 17.95 0.0005
from those of density counts, during June and July 2004. Further Mh  Ti
sampling was carried out only on C. amentacea var. stricta and turf Ti  Si (Mh) Si 5 1.65 0.1493
because no seedlings were found on sand in 2005 and 2006. Col- Residual
lected samples were then transported in water about 18 C to Total 8 8.78 0.0012
laboratory and stored frozen within the same day. Morphological
measures included number of roots (NR), maximum root length 10 1.02 0.425
(LR), numbers of leaves (NL), maximum leaf length (LL) and width
(WL) in cm, percent of apex eroded (PA), and percent of leaf grazed 210
(PL). Rhizome length (LR) was also measured after the first year of
life. The belonging of collected seedlings to the same cohort was 239
checked through the count of leaf scars and scales plus standing
leaves. (B)
2.4. Data analysis Source of variation Interpretation Within HD
Density and morphological data were analysed through ANOVAs Mh  Ti T0>T2 ¼ T3 Within T0
after ensuring homogeneity of variances by Cochran’s C tests. When Mh  Ti HD > SCy ¼ Cy > Gr ¼ Sa Within T1
appropriate, SNK tests were used for multiple a posteriori com- HD > SCy ¼ Cy > Gr ¼ Sa Within T2
parisons of the means. ANOVAs were computed by GMAV 5 soft- HD ¼ SCy ¼ Cy > Gr ¼ Sa
ware (University of Sydney, Australia).
years (Fig. 2). For the other Microhabitats, densities were initially
3. Results higher on HD (16.00 Æ 1.73 and 3.30 Æ 0.50 at the beginning and
after one year, respectively) than on Cy (4.27 Æ 0.56 and
3.1. Seedling density and its variation over time 1.63 Æ 0.26) and SCy (1.94 Æ 0.31 and 1.63 Æ 0.36), but such dif-
ferences vanished in the last year due to a decrease of seedling
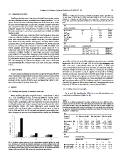
Mean seedling densities ranged from 0.13 Æ 0.08 [mean Æ SE] to densities on HD (Table 1a, b). A significant drop-off of seedling
16 Æ 1.73 seedlings/m2 (Fig. 2). Density differed among micro- density on HD was recorded after the first year (Table 1b). Persis-
habitat types, as revealed by the significant effect of the Mh x Ti tence of seedlings after two years was therefore null on sand and
term (Table 1a). Multiple paired comparisons of means showed that gravel, while it was substantial on rocky vegetated microhabitats,
seedling densities were lower on gravel and sand than on the other with maximum values of 81% at shallow stands of C. amentacea var.
Microhabitats (Table 1b). Such differences were evident two stricta (SCy), values of 47% at deep stands of C. amentacea var. stricta
months after settlement, when seedling densities were as low as (Cy) and of 13% on rocky substrate covered by turf (HD).
0.12 Æ 0.08 and 0.18 Æ 0.10 on sand and gravel, respectively. Den-
sities dropped to zero in these Microhabitats during the following 3.2. Seedling short-term growth
Fig. 2. Seedling density registered in the microhabitats identified within the study LR, LL and WL significantly differed across Microhabitats one
area: Shallow rock covered by Cystoseira amentacea var. stricta (striped bars); rock month after settlement (Table 2a, b).
covered by C. amentacea var. stricta (dark grey); rock covered by Halopteris e Dilophus
spp. (black); gravel (light grey); and sand (white bars). As no significant difference Table 2
between sites was detected, data within each microhabitat were pooled. ANOVA on seedling morphological variables performed in three different micro-
habitats over the short-term. The table shows only variables for which significant
interaction between time and Microhabitat was detected. (A) Main analysis. (B)
Pairwise comparisons (SNK tests). T0: settlement; T1: one month after settlement;
Sa: sand; Cy: rock covered by Cystoseira amentacea var. stricta; HD: rock covered by
Halopteris e Dilophus spp.
(A)
Source of df Max root length Max leaf length Max leaf width
variation Fp
F p Fp
Microhabitat Mh 2 12.27 0.0360 6.64 0.0791 2.6 0.2213
0.0091 60.4 0.0044 205.44 0.0007
Time Ti 1 36.37 0.1719 0.653 0.3056
0.0192 0.55 0.0407 1.27 0.0427
Site (Mh) Si 3 1.81 0.592 11.18 0.5874 10.78 0.9113
Mh  Ti 2 19.44 0.66 0.18
Ti  Si (Mh) 3 0.65
Residual 24
Total 35
(B)
Variable Interpretation
Within time Within microhabitat
Max root length T0 T1 Sa Cy HD
Max leaf length
Max leaf width Sa ¼ Cy ¼ HD Sa < Cy < HD T0 ¼ T1 T0 ¼ T1 T0<T1
Sa ¼ Cy ¼ HD Sa ¼ Cy < HD T0 ¼ T1 T0<T1 T0<T1
Sa ¼ Cy ¼ HD Sa < Cy ¼ HD T0<T1 T0<T1 T0<T1